Build clearly
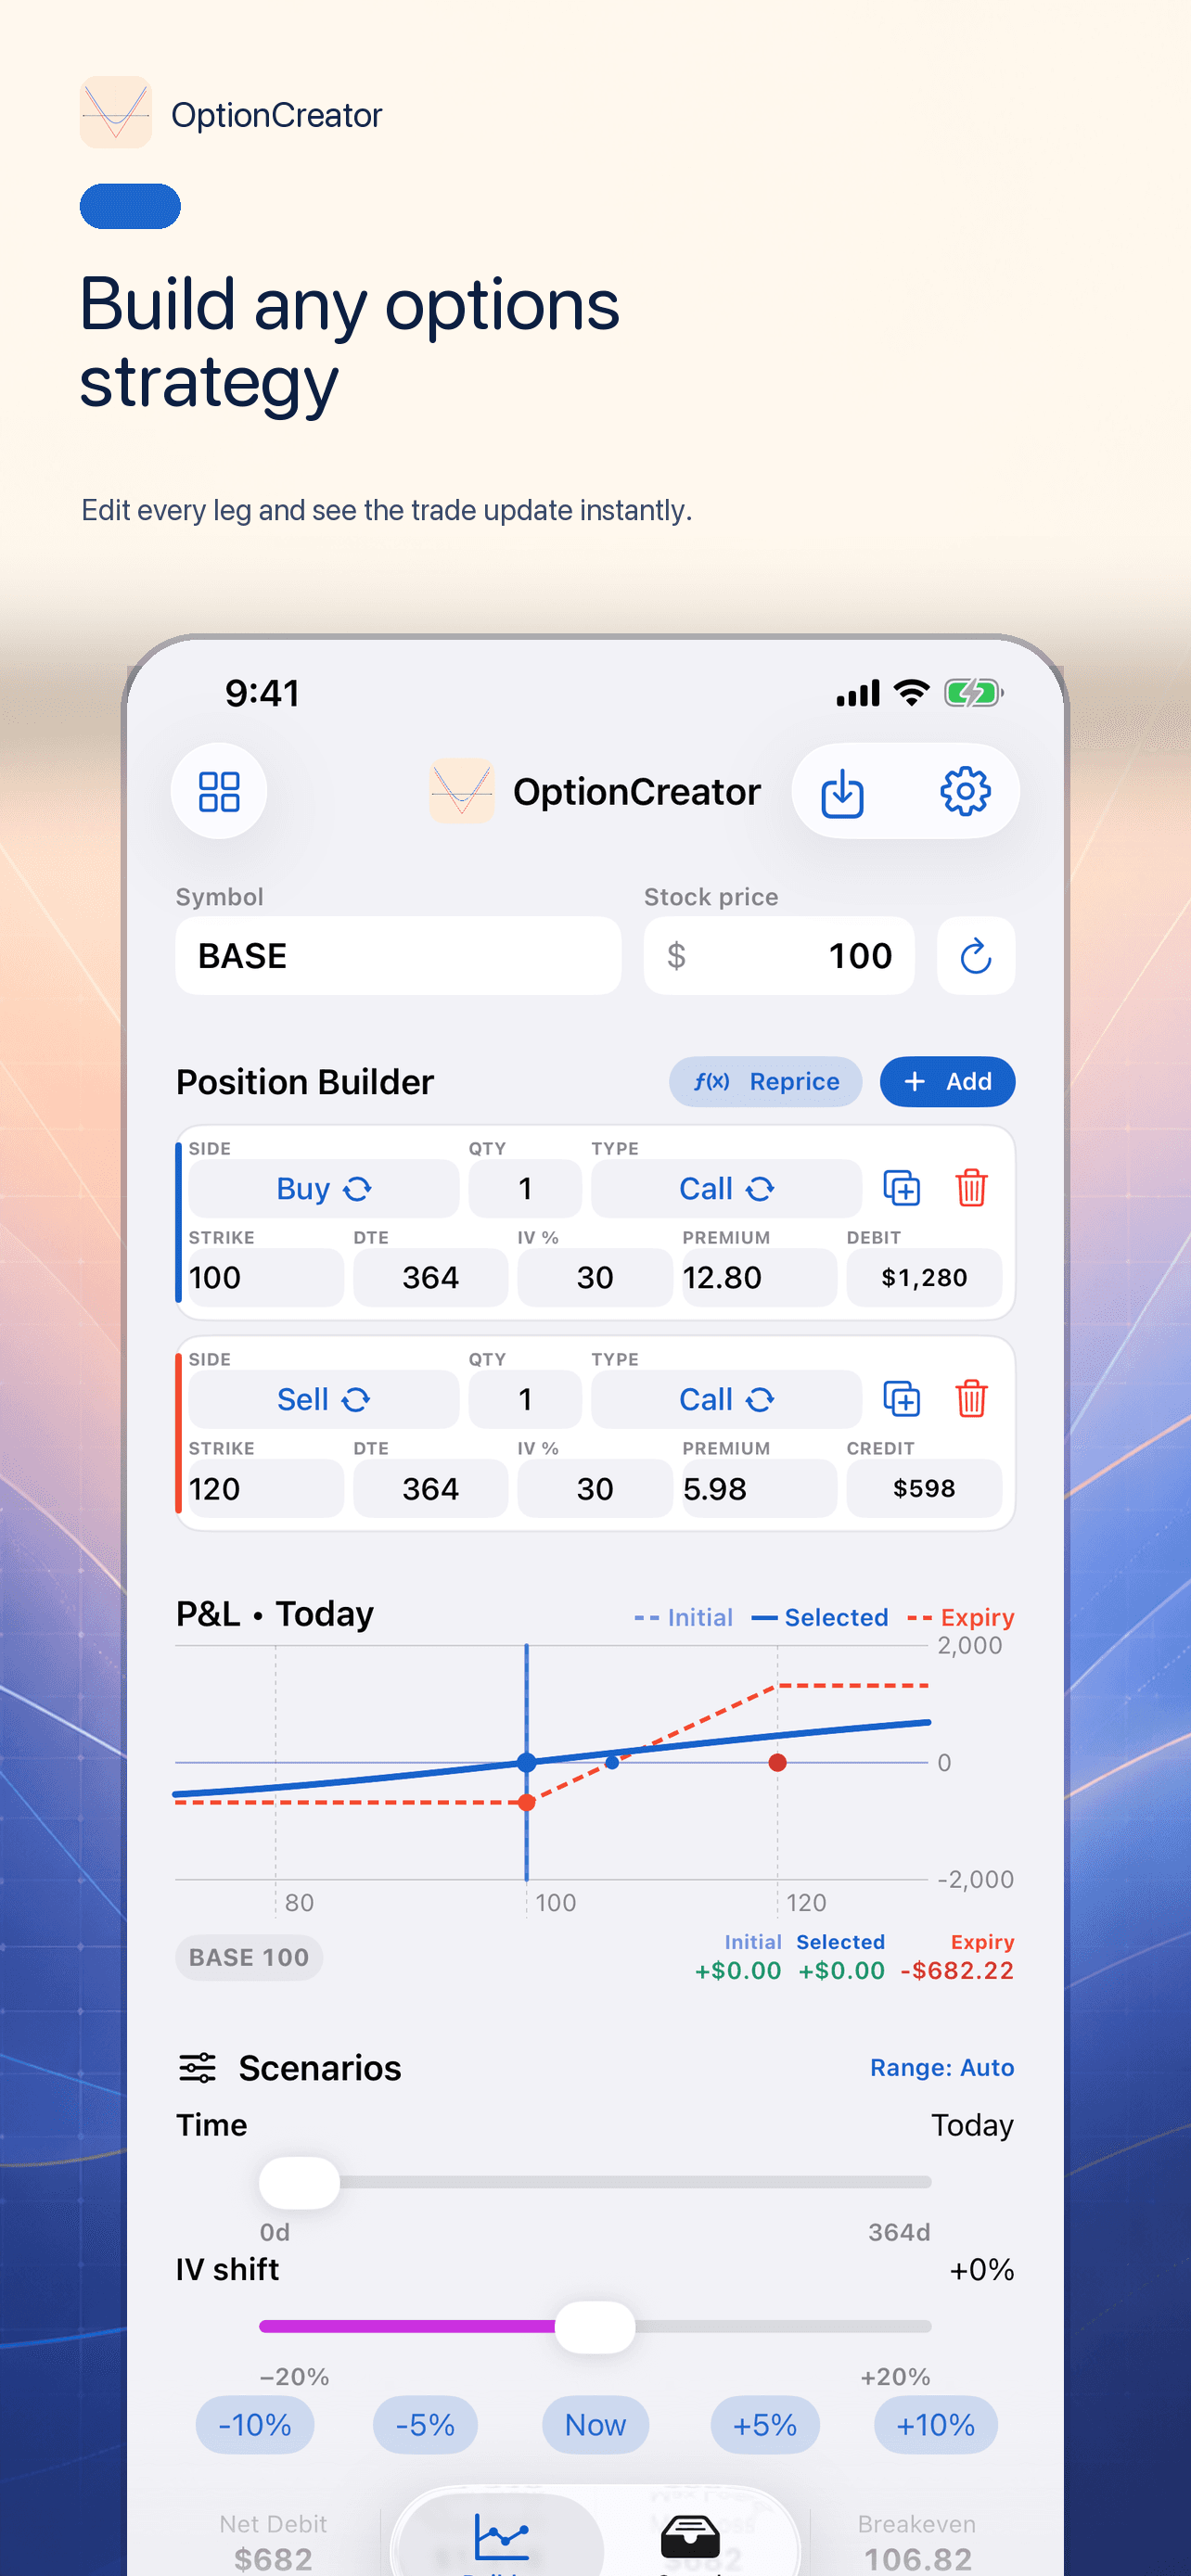
Keep every leg visible and editable on one screen. Duplicate a leg, change its side or type with a tap, and let Black–Scholes estimate the premium.
Visual options strategy builder
OptionCreator turns multi-leg positions into clear, interactive profit-and-loss curves. Build a strategy, change the assumptions, and understand what moves the outcome.
Theoretical estimates are informational and are not investment advice.
Built for understanding
The builder keeps the inputs, chart, scenario controls, and key position metrics in one focused flow.
Keep every leg visible and editable on one screen. Duplicate a leg, change its side or type with a tap, and let Black–Scholes estimate the premium.
See the position at entry, on a selected day, and at expiration. Distinct curves and position markers make the structure easier to read.
Adjust time, implied volatility, and the underlying price range to understand how the theoretical outcome can change.
Inside OptionCreator
Build the position first, then move naturally into its curves, scenario controls, templates, and range tools.
Buy or sell calls, puts, and stock with editable quantities, strikes, dates, volatility, and premiums.
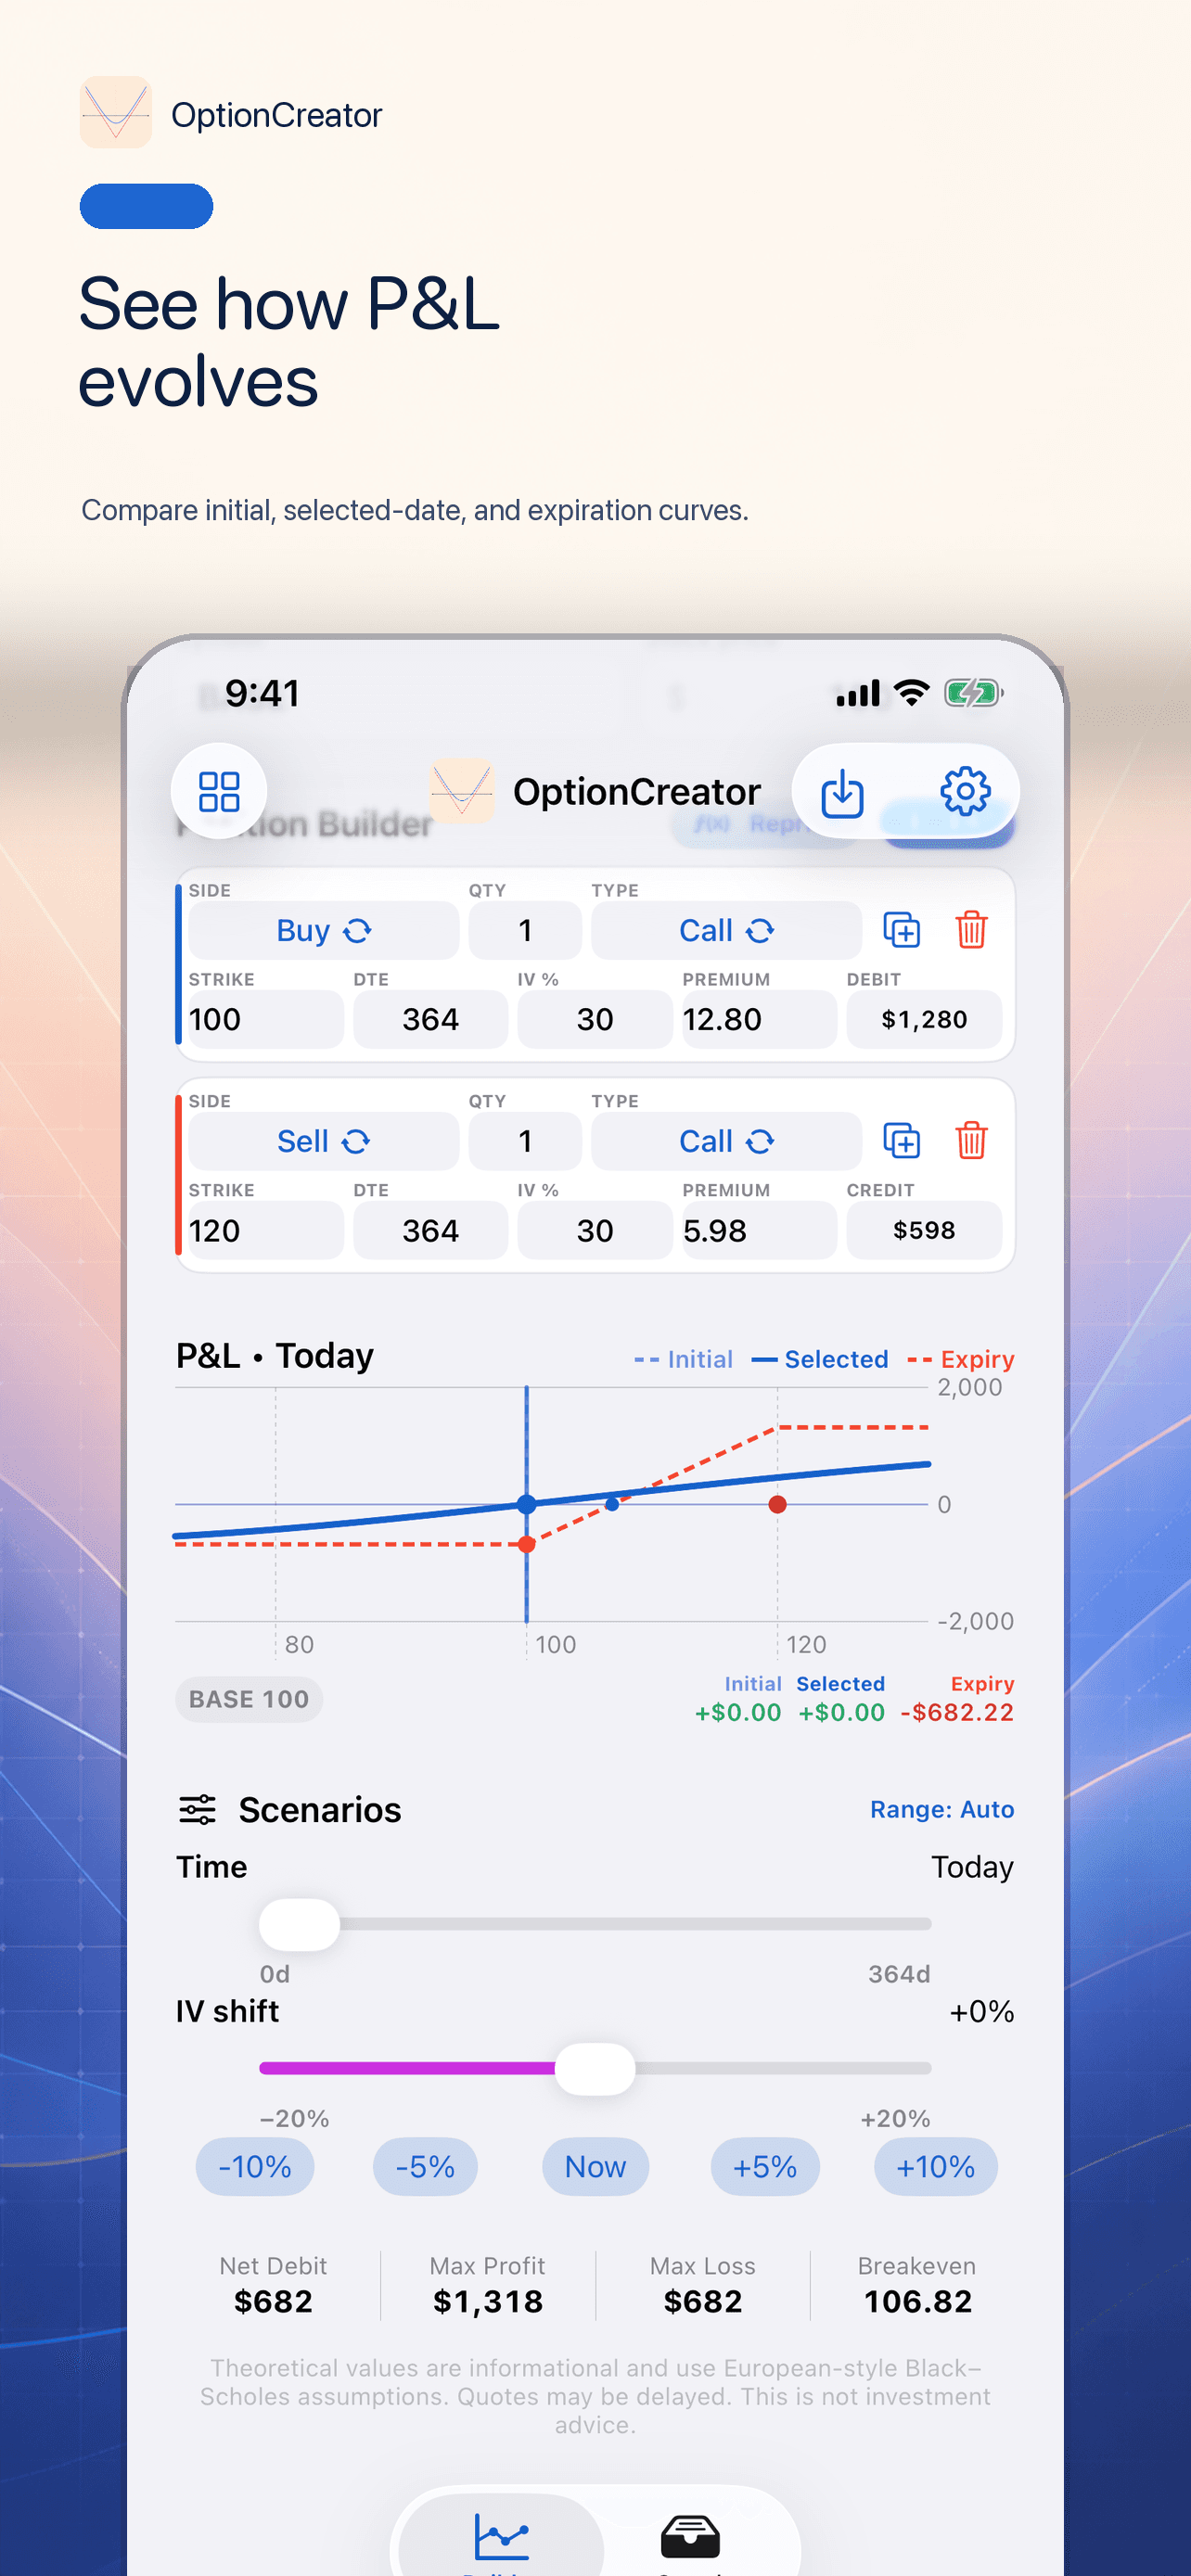
Compare the initial, selected-date, and expiration curves on one readable chart.
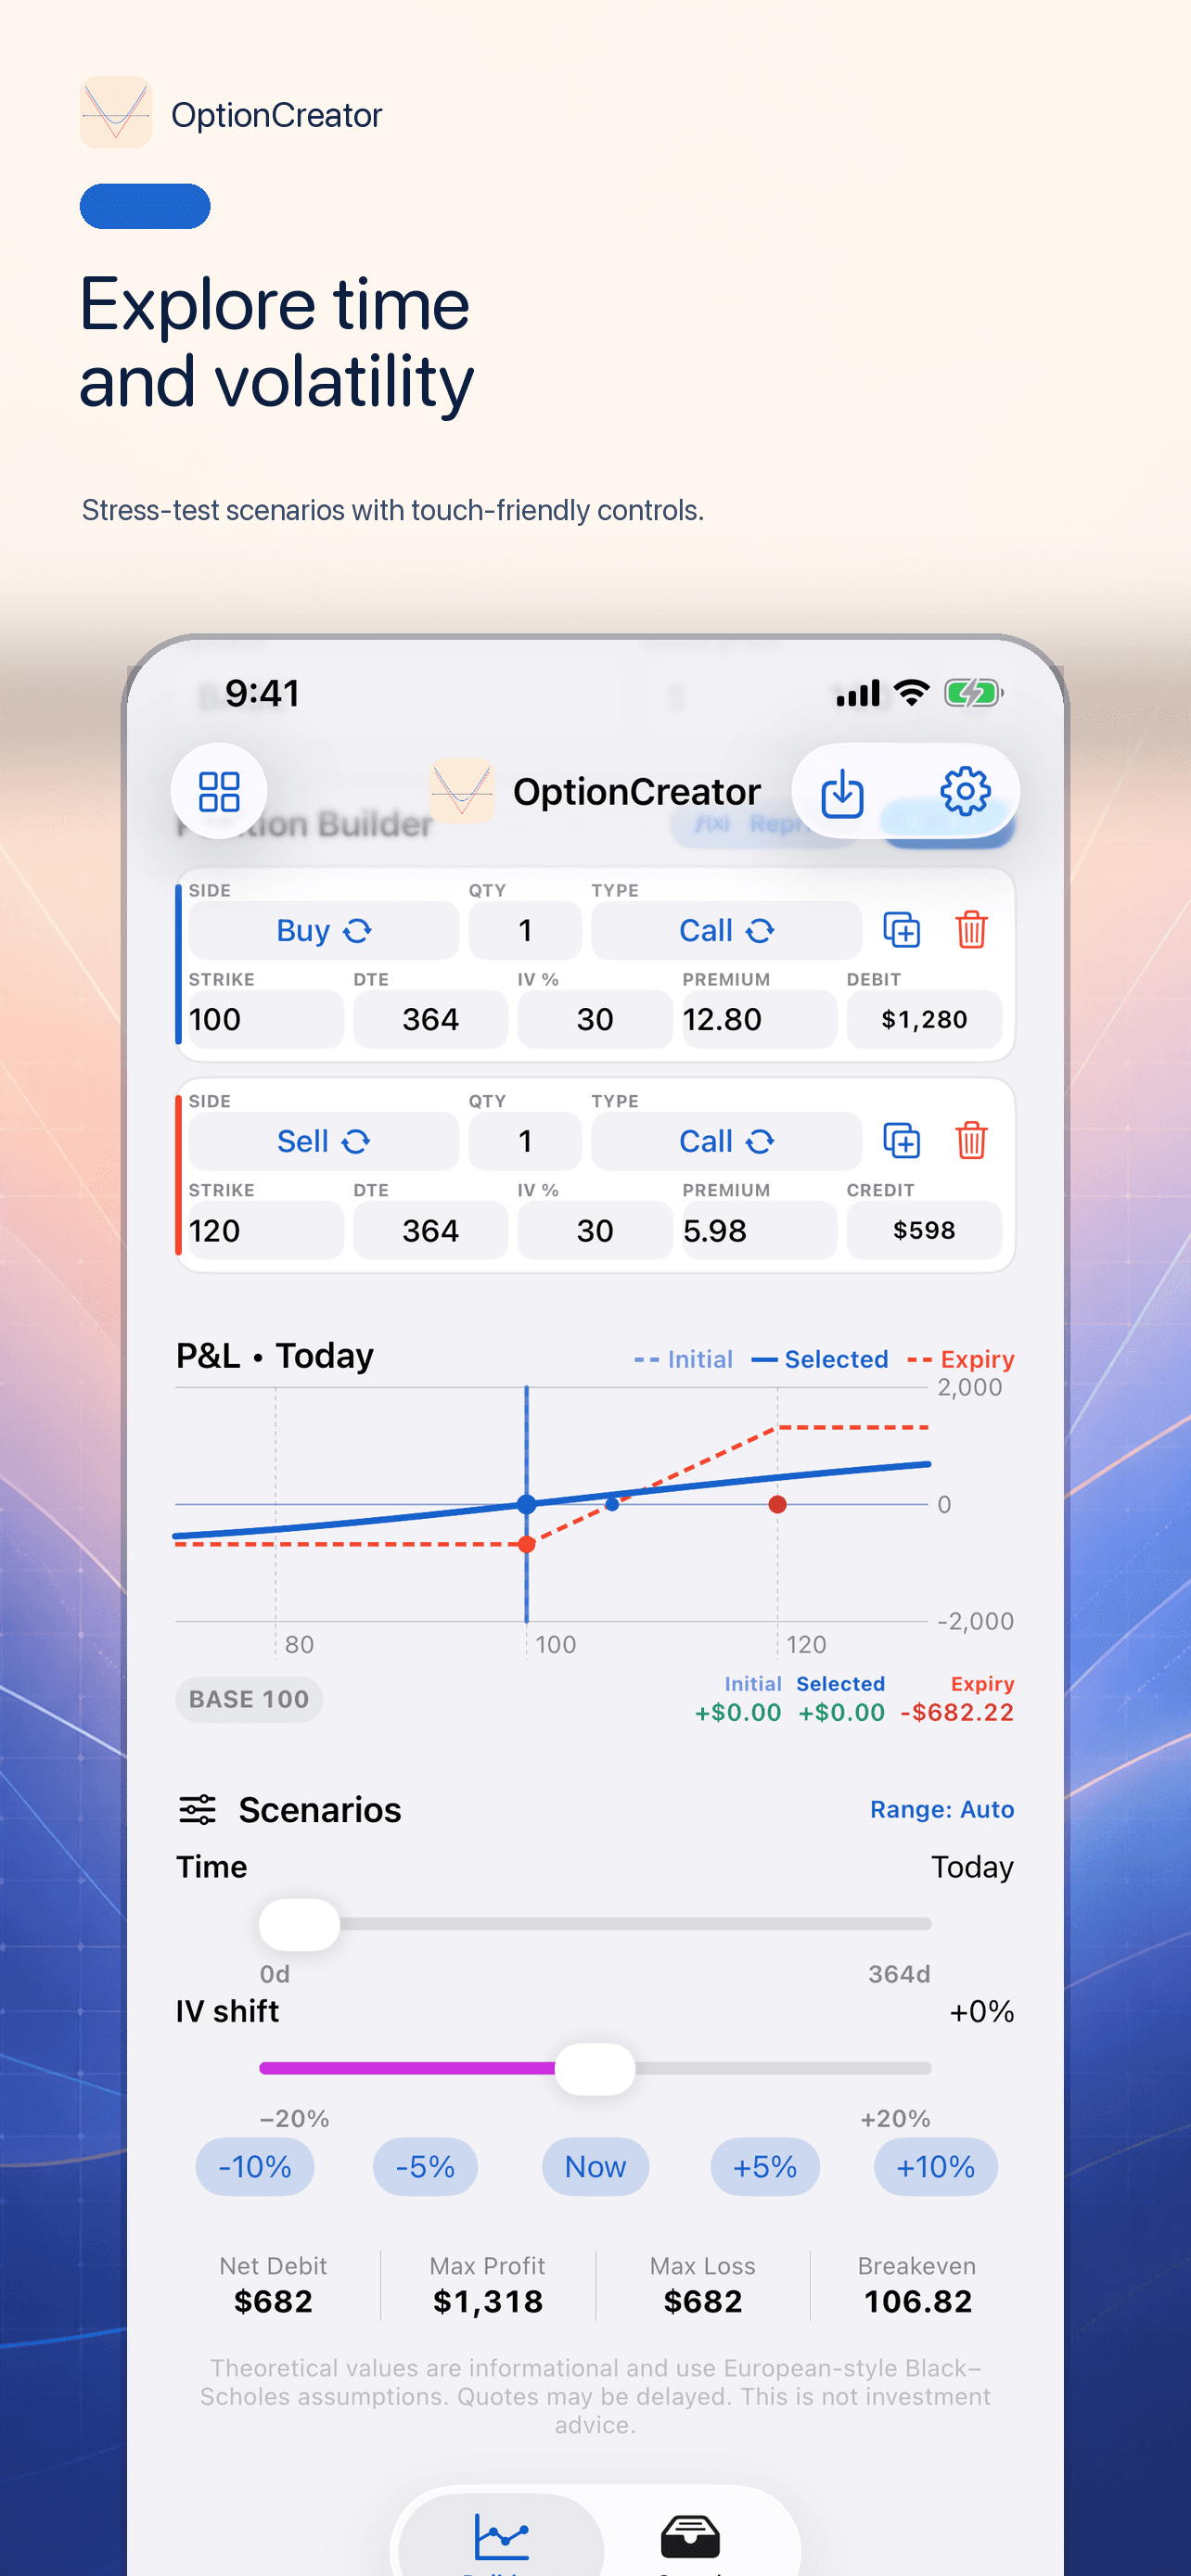
Move through time, shift implied volatility, and inspect prices directly on the curve.

Begin with familiar strategies, then adjust every detail to match the position you want to study.
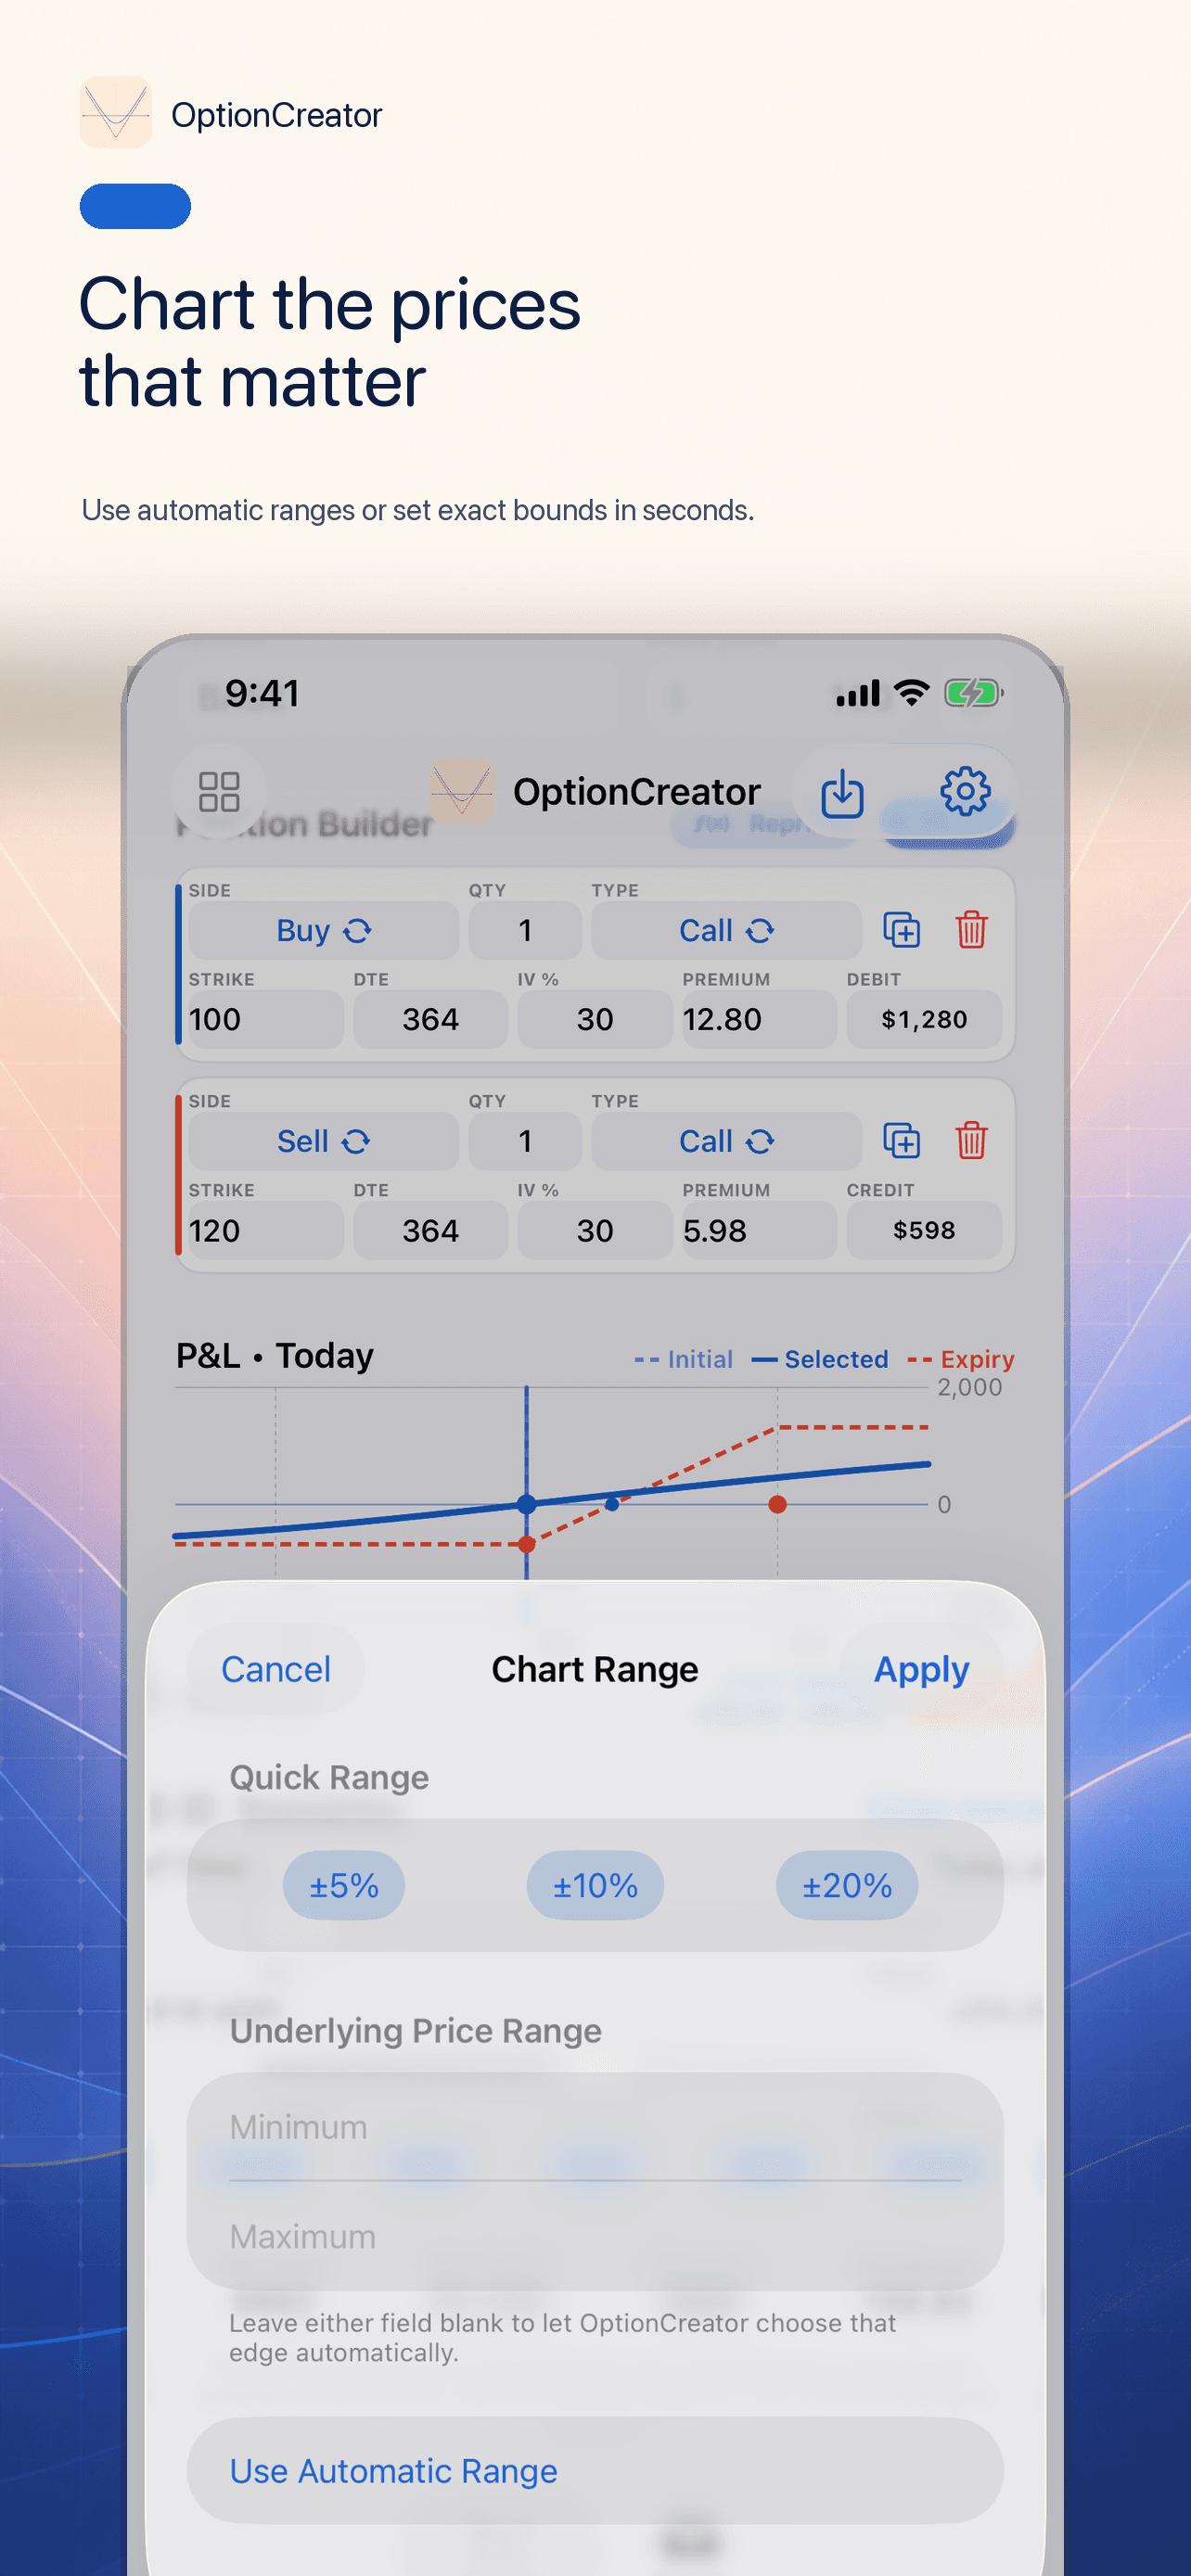
Use automatic bounds, quick percentage ranges, or precise whole-number price limits.
Make the curve visible
OptionCreator is an educational analysis tool using theoretical European-style Black–Scholes assumptions. Market prices may differ.